Streaming applications typically need to process the events as soon as they arrive. For example, being able to quickly react to events in applications such as fraud detection, manufacturing error detection can result in massive savings. However, due to the limitation of storage systems not being able to handle large numbers of small writes, producers are forced to buffer events before they write. This not only leads to increased latencies from the event generation time to event process time but increases the chance of losing events when writers are not able to store them reliably in failure scenarios. Pravega has been built from the ground up to be an ideal store for stream processing because not only can it handle frequent small writes well, but it also does that in a consistent and durable way.
This blog explains how Pravega is able to provide excellent throughput using minimal latency for all writes, big or small. It explores the append path of the Segment Store, detailing how we pipeline external requests and use the append-only Tier 1 log to achieve excellent ingestion performance without sacrificing latency.
How to achieve the best performance
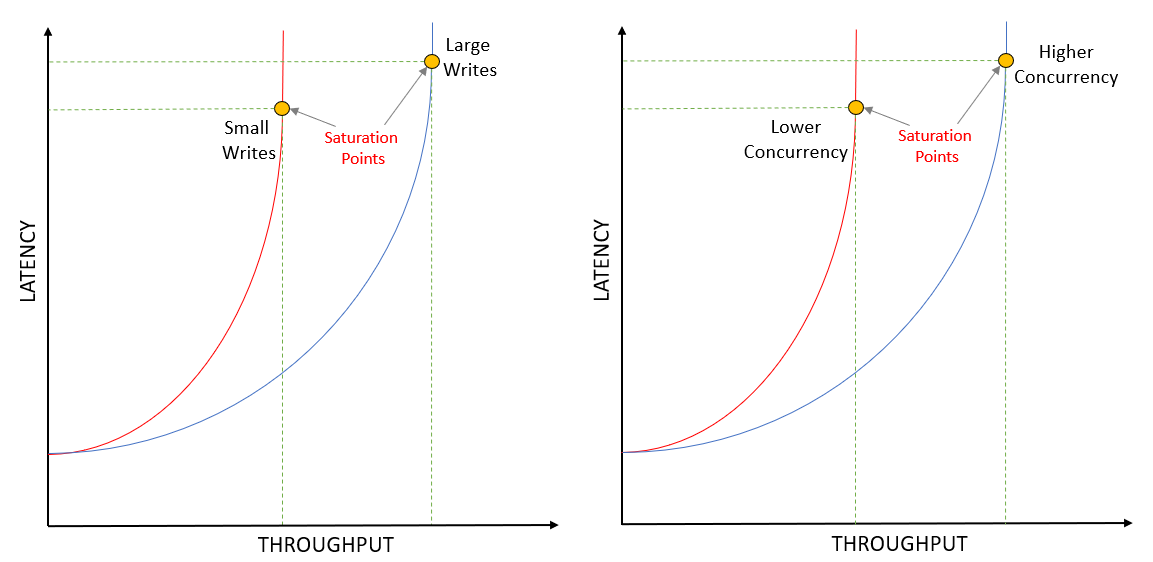
Throughput and latency are two crucial characteristics of any ingestion system. Typically, for light loads, both throughput and latency tend to be low. However, as throughput increases, latency will also increase, up to a saturation point. Beyond this, throughput plateaus, but latency continues to grow, sometimes even at a higher rate. The most significant contributing factor towards this is the queueing effect: if a system is saturated, new writes will be queued up and won’t be processed until all previous writes have finished.
The Segment Store is at the core of Pravega’s data plane. It provides a unified view of Tier 1 and Tier 2 and manages the transfer of data between them; new data is written to Tier 1 and is eventually migrated to Tier 2 storage. We want the Segment Store to add as little overhead as possible and use Tier 1 to ensure low latency and durability.
Due to its excellent log-based, append-only write performance, Pravega uses Apache Bookkeeper for Tier 1. The Bookkeeper client allows multiple writes to be initiated in parallel, by immediately sending them to the appropriate Bookies provided they have the processing capacity, while queueing any writes that cannot be immediately fulfilled. A key performance characteristic for Bookkeeper is that, if we keep the write size constant, non-concurrent writes will always have lower latency and lower throughput than concurrent writes. Similarly, if we keep the degree of concurrency constant, larger writes will always have higher latency and higher throughput than smaller writes. One stands to reason that, to obtain the highest throughput, we must make as large writes as possible and, to have the best latency, we should make writes as small as possible (one per Event). Traditional techniques accumulate data into buffers that only get committed when they fill up or when some timeout expires. That may help throughput, but it certainly constrains the latency to be at least equal to that timeout.

Pravega has solved this problem differently; it analyzes the incoming write patterns and finds the optimal balance between latency and throughput. It does all this without the need for any user-supplied configuration, such as timeouts.
The Ingestion Pipeline
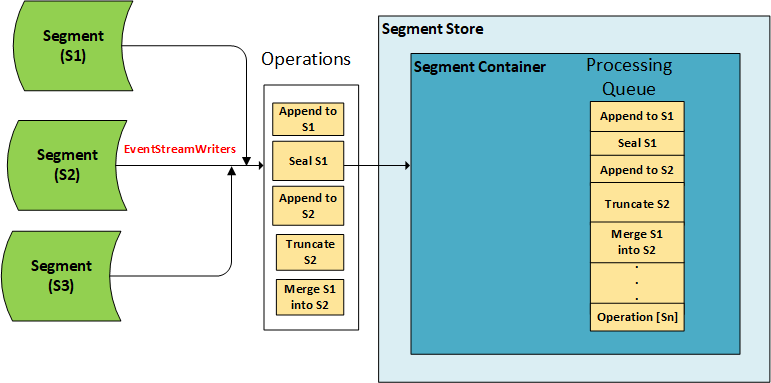
In the Segment Store, every request that modifies a Segment is converted into an Operation and queued up for processing. There are multiple types of operations, each indicating a different modification to the Segment: Append Operations (for storing Events), Seal Operations (for making a Segment read-only), Merge Operations (used to merge Transactions), Truncate Operations (for retention), etc. A Segment Container has a single, dedicated Tier 1 log to which it writes all operations it receives. Many Segments can be mapped to a single Segment Container, so all operations from a Container’s Segments are multiplexed into that single log. This is a crucial design feature which enables Pravega to support a large number of Segments: since we do not need to allocate any physical resources for a Segment (such as a Bookkeeper ledger), we can create an unlimited number of Segments that share a much smaller number of Tier 1 logs. This also helps with handling small writes efficiently and managing Streams with variable ingest rates.

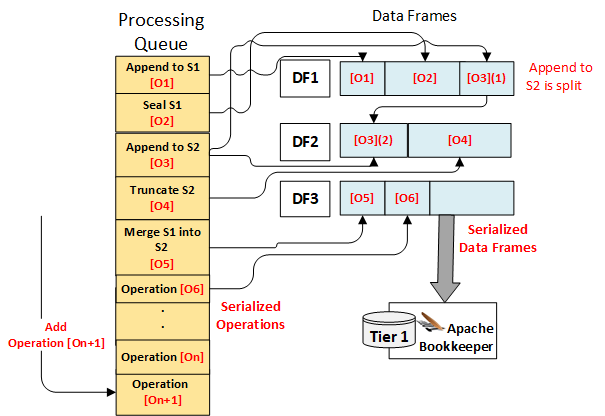
Every new Operation is added to an in-memory processing queue, which defines the final order of Operations in the system. The Operation Processor, an internal component of the Durable Log, handles all the Operations added to this queue. It works sequentially, picking the next available Operations from the queue, validating them and writing them to Tier 1, before moving on with the next set of Operations. Even though it is sequential, the Operation Processor does not wait for a Tier 1 write to complete before processing the next batch. Bookkeeper allows writes to be pipelined – several writes can be issued concurrently and acknowledging one of them implies that all writes requested before it have also been accepted. The Operation Processor aggregates multiple operations into Data Frames and initiates Tier 1 writes for each such Data Frame, after which it starts building the next Data Frame. When Tier 1 acknowledges that write, the Operation Processor asynchronously accepts those Operations into the internal state of the Segment Container.
While this technique allows us to fully utilize the network link between the Segment Store and Tier 1, it does introduce the following problems – How to choose the best number of operations to include in a single Tier 1 write? How to validate operations that may depend on previous “in-flight” operations that haven’t yet been acknowledged from Tier 1? Let’s examine each of these in turn.
Choosing a Good Write Size
Data Frames are the unit of writing to Tier 1; they are ordinary byte buffers with a maximum length of 1MB. Each Data Frame can hold any number of Operations, with larger Operations able to span more than one frame. The Operations are written to Data Frames in the same order as in the processing queue, which implies that Data Frames are ordered as well: each Data Frame appended to Tier 1 is a successor to the frame that was appended immediately before it. This ordering ensures that we can reconstruct the state of each segment in the Segment Container during recovery by simply replaying the Tier 1 log, which will provide us with the Operations in the same order as we initially processed them.

When deciding how many Operations to write to the next Data Frame, the Operation Processor uses a dynamic batching algorithm that considers the number of pending operations in the processing queue and the recent performance of Tier 1 writes. Its goal is to maximize throughput when demand is high and minimize latency when demand is low. The Operation Processor will aim to write as much as it can to a Data Frame as long as there are Operations available to add to it – if such an Operation is already waiting in the queue then it will be added right away. Once a Data Frame fills up or there are no more Operations immediately available to add, the Data Frame is written to Tier 1.
While this approach helps throughput, it does have a limitation: in most cases, operations arrive a few microseconds apart, which is enough time for the Operation Processor to serialize the previous operation and think there is nothing else to process, thus sending the Data Frame to Tier 1 and causing a flood of very small writes to Tier 1 that degrade performance. Other ingestion systems resolve this by waiting a predetermined amount of time between writes so that more data can be gathered. However that puts a floor on the latency that the system can provide. Pravega takes a different approach. When it reaches a situation when there are no more operations to pick from the processing queue, the Operation Processor uses recent Tier 1 latency information and write sizes to calculate the amount of time to wait:
![]()
The delay is directly proportional to the recent Tier 1 latency and inversely proportional to the recent average write size. If recent Data Frames had a high fill rate, then the system is already maximizing throughput, so there is no reason to delay anymore – we send as much data as we can to Tier 1 and let the Tier 1 client manage the load. If we end up sending too much, the Recent Latency will increase (due to queueing effect) which will also increase our Delay and act as a throttling mechanism.
On the other hand, if recent Data Frames were underutilized, it doesn’t hurt to wait a little longer in hopes that more operations will arrive so that they may be batched together, potentially improving throughput. In any situation, it makes no sense to exceed the Tier 1 latency, hence the delay is capped by recent average Tier 1 latency. Also, to prevent overreacting to temporary blips in Tier 1, we have decided to put a ceiling to this delay. Note that other factors, such as additional throttling introduced if Tier 2 cannot keep up with Tier 1, could influence the amount of time the Operation Processor “pauses” between cycles.
Keeping Track of Metadata Updates
Each Operation changes the state of a Segment. As such, before writing it to Tier 1, each Operation needs to be validated against the effects of all operations that were accepted before it. This includes Operations that were written to Tier 1 a long time ago whose effects are already visible in the Segment’s Metadata and those that are currently “in flight”. For example, a Segment may receive a Seal Operation, followed immediately by an Append Operation. Both the Seal and the Append may be queued up, but the Seal was first, which means the Append must be rejected due to the segment being sealed. This is a relatively easy problem to solve. We can validate operations as they are added to the processing queue, keeping track of the effects of accepted operations and immediately rejecting non-conforming ones.
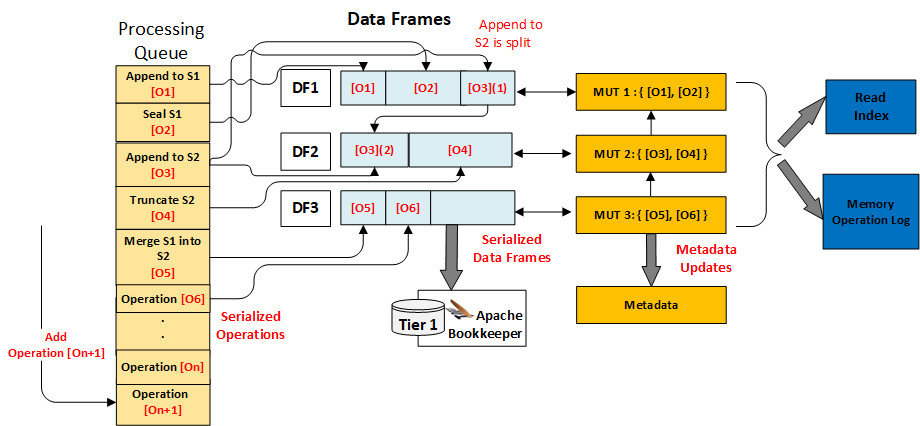
However, this is only one part of the problem. Since Pravega provides exactly once guarantees, we cannot make the effects of an Operation visible until that Operation has been durably persisted to Tier 1. As such, we cannot make the contents of an Append Operation ready for reading or the fact that a Segment has been sealed visible until their corresponding Operations have been serialized to Data Frames, and those Data Frames have been acknowledged by Tier 1. Not doing so may cause us to erroneously serve data or take other actions even if we are not sure whether that change would survive a system crash. Therefore, we cannot update our internal metadata as soon as we receive the operation, rather it will have to be done after successfully writing to Tier 1. We need a solution that can be used to validate the Operations as they come in, keep track of their supposed changes, and efficiently integrate those changes to the main Segment Container Metadata once the Operations have been durably written.
The Operation Processor solves this problem by associating a Metadata Update Transaction to each Data Frame that it generates. Each such Metadata Update Transaction contains changes to the Container Metadata that would be the result of applying the Operations serialized in that Data Frame. Since the Data Frames are ordered and their Operations are validated based on changes from the previous Operations, each Metadata Update Transaction is built on top of the one associated with the previous Data Frame and reflects all changes contained in that one. The head transaction (at the beginning of the queue) is chained on top of the Container Metadata so it reflects the current state of things. When a Data Frame is acknowledged from Tier 1, its corresponding Metadata Update Transaction is merged into the Container Metadata, thus making the effects of all serialized operations within it visible to the whole system. If multiple transactions are eligible for merging (due to out-of-order acks), they will be merged sequentially, beginning from the head.

Tier 1 Write Failures
If the Segment Store receives an invalid request for a Segment (such as appending to a sealed segment), its corresponding Operation is quickly failed, and it will never be serialized to a Data Frame, even less make it to Tier 1. However, we need to account that Tier 1 is an external service which is prone to failure or connection losses. While most writes are successful, it is possible that Tier 1 may experience temporary degradation of service which could lead to write failures. Some failures may indicate a Data Frame has not been committed, but in case of others (such as timeouts), we may not know if it was written or not. The Bookkeeper Client does reattempt any failed writes that are retriable, so it makes little sense for us to retry too. Additionally, it guarantees that if a write failed, then all subsequent writes to that same ledger will also be failed (otherwise we could be writing data out of order).
Pravega could attempt to reconcile the situation on the spot by reconnecting and figuring out what the last written Data Frame was, but such an approach would be expensive and prone to error. If such a situation arises, we have decided that the best solution is to stop the Operation Processor and its owning Segment Container. Even though this will fail all in-flight requests from the Pravega Client to the Segments in that Container, by shutting the Segment Container down, we can go back to the Controller and ask if this Segment Store instance is still its rightful owner, and if so, we attempt a restart. The recovery process will make it very clear as to what exactly has been written to Tier 1 so there will be no ambiguity about that. Once the Segment Container has fully recovered, the Client’s EventStreamWriters and EventStreamReaders will need to reconnect and reconcile their states, after which they can resume writing or reading.
Common Ingestion Scenarios
In this post, we have described our approach to pipelining Operations and explained our thinking behind the dynamic batching algorithm that the Segment Store uses internally. Let’s take a closer look at three different ingestion patterns and see how the Operation Processor’s pipeline behaves in each case:
Infrequent Operations.
The Segment Store receives requests rather infrequently, and the Operation processing queue rarely has more than one outstanding Operation in it.
In this situation, the Operation Processor will package each Operation into a Data Frame by itself and write it to Tier 1. This will be the smallest ingestion latency offered by the Segment Store, and it will match that of the Tier 1 storage system.
Large flow of very small appends.
The Segment Store receives a continuous stream of small requests (like less than 100 bytes each), causing the Operation Processing queue to always have a significant number of Operations.
Instead of writing each Operation into a Data Frame by itself, the Operation Processor will bundle multiple operations into a Data Frame before writing them to Tier 1. By batching operations together, we can achieve a much higher throughput than otherwise without needing to resort to write queuing on Tier 1. Even though the per-operation latency will be slightly higher than in the single-stream write flow, throughput is much improved and is only bounded by the network link between the Segment Store and Tier 1.
Large flow of small and/or large appends.
The Segment Store receives a continuous stream of requests of various sizes, causing the Operation Processing queue to always be non-empty.
The Operation Processor will bundle multiple operations into Data Frames, where each Data Frame is likely to reach its maximum capacity. This will cause Tier 1 to reach the ingestion saturation point, in which case throughput is maximized, and latency will vary based on the amount of time these writes stay in the write queue. If we were to perform no batching whatsoever, the ingestion saturation point would be lower (more Tier 1 writes) so we would not be achieving maximum throughput.
Wrapping up
This blog was the first deep dive into the components of the Segment Store. We took a closer look at one of the most critical parts of the ingestion path – the Operation Processor – and examined how it handles incoming requests and durably persists them into Tier 1. We also explained our thinking behind the complex pipelining logic that occurs within and why we believe it helps with performance for a variety of scenarios.
Acknowledgments
Thanks to Srikanth Satya and Flavio Junqueira for the comments that helped to shape this post.
About the Author

Andrei Paduroiu is among the original group of developers who started the Pravega project and is currently a core contributor, owning the data plane server-side aspects of it – the Segment Store. He holds a MS Degree from Northeastern University and a BS Degree from Worcester Polytechnic Institute. Previously, Andrei held a software engineering position with Microsoft and Vistaprint. Andrei’s interests include distributed systems, search engines, and machine learning.
